
Fieldata provides a seamless workflow for data collection, visualization, and analysis, ensuring organizations can gather insights efficiently and securely. Here’s a breakdown of how Fieldata works through its main stages: Create, Collect, Visualize, and Export.
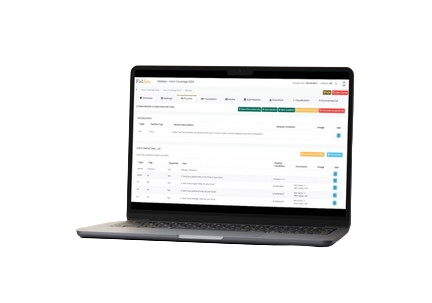
Fieldata allows you to design custom surveys tailored to your needs through both ODK (Open Data Kit) forms and web-based. Whether you prefer working offline or online, Fieldata’s form-building tools are versatile and user-friendly.
 ODK Forms
Use powerful ODK tools to create complex, logic-driven surveys that can be deployed even in remote locations with limited connectivity. You can define question types, add validation rules, set skip logic, and more to ensure accuracy in data collection.
 Web-Based
For users looking for a more accessible, graphical interface, Fieldata also offers web-based form creation. You can build surveys with simple drag-and-drop features, enabling anyone without technical expertise to design forms quickly and efficiently.
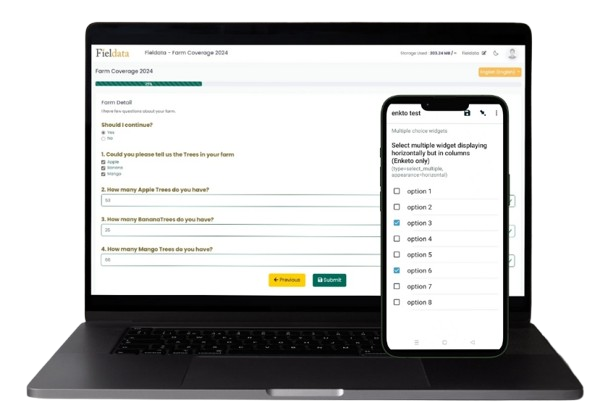
Once your forms are created, they can be distributed to field agents via the Fieldata mobile app or accessed through a web portal. Fieldata supports both online and offline data collection,ensuring that agents can capture information in any location.
 Mobile Data Collection
Field agents can use mobile devices to collect data in real time, even in remote areas without internet access. Fieldata’s mobile app is designed to work offline, allowing users to save responses and synchronize data later when internet access is available.
 Offline and Online Flexibility
The platform’s flexibility ensures that data is never lost, no matter where it's collected. Offline data collection ensures that once internet access is available, all information is securely uploaded to the central server for further analysis.
Once data is collected, Fieldata provides tools to visualize and analyze the information in real-time through customizable dashboards and detailed reports.

 Customizable Reports & Dashboards
Fieldata allows you to track responses, view data trends, and generate insightful reports. You can create tailored visualizations such as bar charts, line graphs, heat maps, and more to make data easier to interpret and act upon.
 Real-Time Data Analysis
The platform ensures that data is available for analysis as soon as it is submitted, offering real-time insights into ongoing projects. This allows for quick decision-making and adjustments during data collection efforts.
Fieldata offers robust data quality checks, monitoring key metrics such as timestamps, GPS locations, and data entry patterns, ensuring the validity and reliability of the collected data.
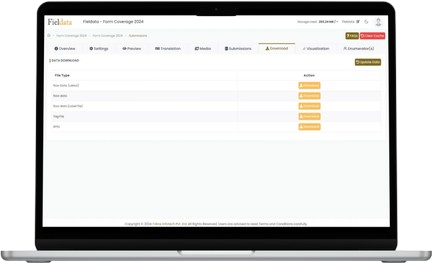
After data has been collected and analyzed, Fieldata provides flexible options to export and share the results in various formats to meet your needs.
 Multiple Export Formats
Data can be exported in a variety of formats, including Excel, CSV, SPSS, Stata, JSON, and media files. This allows you to integrate the data with other systems or share it with different stakeholders.
 Team Collaboration
Fieldata makes it easy to share reports, visualizations, and raw data with your team or clients, enabling smooth collaboration. You can set access permissions, allowing specific team members to view or edit data as needed.
 Automated Reports
The platform also supports setting up scheduled reports, which can be automatically emailed to stakeholders, ensuring everyone is updated regularly.
By using this website you agree with the use of cookies, detailed in our privacy policy